14 May 2015 Second Quarter Outlook
by Andy Kapyrin, CFA, RegentAtlantic Capital
Are people too comfortable with what’s familiar to them? We know that familiarity tends to create confidence. After all, we often want to do business with friends and family members, dine in restaurants we’ve visited before, and take repeat vacations to our favorite destinations. It’s natural to be risk-averse about things that are important to us…but what if we’re missing something? What if there are better business opportunities out there, exquisite meals that we’re overlooking, and as-yet-unvisited destinations that may offer us once-in-a-lifetime experiences?
Investors have a tendency to be comfortable with the familiar, too. The most common way we see this in a portfolio is what we call the home-country bias–the tendency to over-invest in companies based in our country of citizenship—while avoiding investment opportunities abroad. Some investors view this as a smart, risk-avoidance strategy: If they don’t recognize the names of foreign companies and aren’t sure of their business model, they’re skeptical. But as with the other situations mentioned above, investors may be giving up a strong return opportunity and could even be taking more financial risk than they know, just by not looking farther afield.
To be frank, we would say that investors who avoid looking abroad are missing out. Our world has become increasingly globalized, and many of the largest international companies are becoming household names here in the United States. More important, a prudently balanced portfolio that invests in both U.S. and international stocks can actually reduce risk. And now is an especially important time to stay globally diversified, with the growth outlook abroad improving.
Are International Stocks Really So Foreign?
Familiarity can help boost our investing confidence, so let’s ask ourselves if, perhaps, we’re familiar with international stocks after all. Among the largest companies, by market value, based outside the United States, we may find some names that are extremely familiar to U.S. consumers. Some examples include Nestle (headquartered in Switzerland), Toyota (Japan), HSBC (United Kingdom), and Bayer (Germany). So maybe international stocks are not as foreign as we thought, after all.
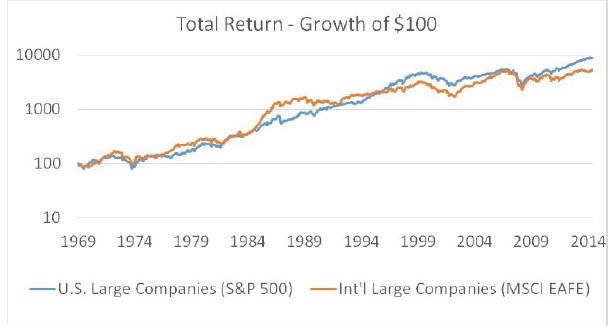
The market cycles of international stocks aren’t foreign, either. They go through their own booms and busts, though their cycles don’t overlap perfectly with our own. You can see on the chart above that investor sentiment sometimes pushes one category of stocks (U.S. or international) ahead of the other, and that’s one reason a portfolio that includes both geographic sectors can be less risky. A portfolio that invests in both categories won’t end up at either extreme end of returns. When one category is in favor and the other is out of favor, the combination is likely to earn a smoother rate of return over time.
How Much Should We Invest in International Stocks?
What percentage of international stocks should be held in a diversified portfolio, in an effort to maximize the benefits of diversification? One method might be to simply split them 50-50, equally weighting U.S. stocks and international stocks. Another intuitive way might be to weight them in proportion to their market values—that happens to give us a result that is very close to a 50-50 split today, as well.
A more scientific way to respond to this question is to look at historical returns and see what blends of U.S. and international stocks result in the lowest historical risk. We measure risk using standard deviation, which measures how close together or far apart the annual returns of a portfolio are. A higher standard deviation would mean that the returns are more scattered, and so more likely to have experienced large gains and outsize losses. A lower standard deviation is desirable, all else equal.
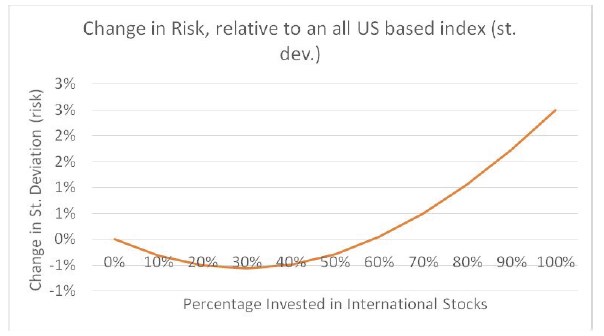
For our research, we blended U.S. stocks and international stocks in 10% increments and tested their historical risk. We found that diversified portfolios have, in fact, been less risky, but only up to a point: A portfolio that allocates 60% or more of its investments abroad has actually taken more risk than one that doesn’t diversify at all—an interesting revelation. We also found that the intuitive method of splitting allocations 50-50 has not been the best mix to limit risk. The sweet spot is in the 30-40% range, and that’s the range we generally target when constructing our portfolios.
Chart Source: RegentAtlantic
The Growth Outlook for International Stocks
We believe diversifying into international stocks makes sense for the long-term. It is a core principle of our RegentAtlantic investment strategy. Today, we find that the case for owning international stocks is stronger still. One of the biggest stories of last year was the surge in the value of the U.S. dollar, something that boosted our buying power as Americans. Major foreign currencies like the yen and the euro cheapened by more than 10%, by contrast.
While we might be inclined to bask in the knowledge that our economy appears to be the strongest in the developed world and the dollar is at its highest value in more than 10 years, we would be missing out on an opportunity by ignoring international stocks today.
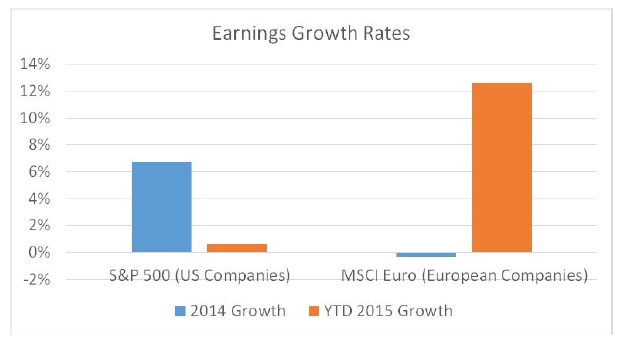
Currencies can make big differences in company profits. Case in point: Europe. Last year, U.S. companies registered an earnings growth rate of more than 6%, while those in Europe struggled due to ongoing economic concerns. The diverging fates of our two currencies, though, have made for a large reversal of fortune so far this year. U.S. companies have struggled to compete abroad due to the strong dollar, while the cheaper euro has given Europe and its major businesses an important boost. Their earnings are up more than 12% so far this year.
Our conclusion: International diversification is a strategy that makes sense over the long term, and could be an especially interesting opportunity right now. Cheaper currencies could help international companies grow their earnings faster and aid their economies in the healing process.
It’s time for us, as investors, to make sure we venture out of our home-country comfort zones so we can enjoy the benefits of international stocks—namely, potentially lower risk and the potential for higher growth.
Andy Kapyrin, CFA, is the Director of Research with RegentAtlantic Capital in Morristown. He may be reached at akapyrin@regentatlantic.com or (973) 425-8420 x251.
This story was first posted in May 2015.
This is a sponsored section. The advisors have paid a fee to post their commentary here. Their sponsorship doesn’t influence any editorial decisions we make at NJMoneyHelp.com, or give them more or less exposure in our stories. Their posting does not constitute an endorsement by NJMoneyHelp.com.
Important Disclosure Information
Please remember that different types of investments involve varying degrees of risk, including the loss of money invested. Past performance may not be indicative of future results. Therefore, it should not be assumed that future performance of any specific investment or investment strategy, including the investments or investment strategies recommended or undertaken by RegentAtlantic Capital, LLC (“RegentAtlantic”) will be profitable. Please remember to contact RegentAtlantic if there are any changes in your personal or financial situation or investment objectives for the purpose of reviewing our previous recommendations and services, or if you wish to impose, add, or modify any reasonable restrictions to our investment management services. A copy of our current written disclosure statement discussing our advisory services and fees is available for your review upon request. This article is not a substitute for personalized advice from RegentAtlantic. This article is current only as of the date on which it was sent.
The statements and opinions expressed are, however, subject to change without notice based on market and other conditions and may differ from opinions expressed in other businesses and activities of RegentAtlantic. Descriptions of RegentAtlantic’s process and strategies are based on general practice and we may make exceptions in specific cases.
The index returns shown above show the total return for various investment indices and include the impact of the reinvestment of dividends. A comparison to indices may not be a meaningful comparison. Comparisons to benchmarks have limitations because benchmarks have volatility and other material characteristics that may differ from the performance of a client’s portfolio. The investments in a client’s portfolio may differ substantially from the securities that comprise each index and are not intended to track the returns of any index. One cannot invest directly
in an index, nor is any index representative of any client’s portfolio. Actual client accounts will hold different securities than the ones included in each index. The index returns are gross of applicable account transaction, custodial, and investment management fees. The actual investment results would be reduced by such fees and any other expenses incurred as an investor. Please below for definitions of the indexes used.
S&P 500 Index – The S&P 500 is an index consisting of 500 stocks chosen for market size, liquidity and industry grouping, among other factors. The S&P 500 is designed to be a leading indicator of U.S. equities and is meant to reflect the risk/return characteristics of the large-cap universe. Each constituent in an index is weighted by its market capitalization, as determined by multiplying its price by the number of shares outstanding after float adjustment. The price return of an index is a measure of the cap-weighted price movement of each constituent within the index.
MSCI Euro – The MSCI EMU Index (European Economic and Monetary Union) captures large and mid cap representation across the 10 Developed Markets countries in the EMU. The index consists of stocks in the following developed market countries: Austria, Belgium, Findland, France, Germany, Greece, Ireland, Italy, the Netherlands, Portugal and Spain. The index contains almost 300 stocks and represents about 85% of the market capitalization of these countries.
MSCI EAFE – The MSCI Europe, Australia and Far East (EAFE) Index is a free float-adjusted market capitalization weighted that is designed to measure equity market performance in foreign developed markets. The index represents about 85% of the market capitalization of developed markets outside of North America. and emerging markets that excludes companies based in the United States. The MSCI ACWI consists of 44 country indices comprising 23 developed and 21 emerging market country indices.
MSCI All Country World Index ex USA – The MSCI All Country World Index (ACWI) ex USA is a free float-adjusted market capitalization weighted index that is designed to measure the equity market performance of developed and emerging markets that excludes companies based in the United States. The MSCI ACWI consists of 44 country indices comprising 23 developed and 21 emerging market country indices.
MSCI USA Index – The MSCI USA Index is designed to measure the performance of the large and mid cap segments of the US market. With 628 constituents, the index covers approximately 85% of the free float-adjusted market capitalization in the US.


